Your Data, With Market Context
Stop wondering if you're ahead or behind. See your portfolio benchmarked against 15 competing properties, automatically.
Automated Comp Set Benchmarking
No more manual market surveys or outdated spreadsheets. We automatically monitor 15 competing properties around each of your assets, tracking executed rents, occupancy, and leasing velocity in real-time.
See Your Rents vs. Market Rents
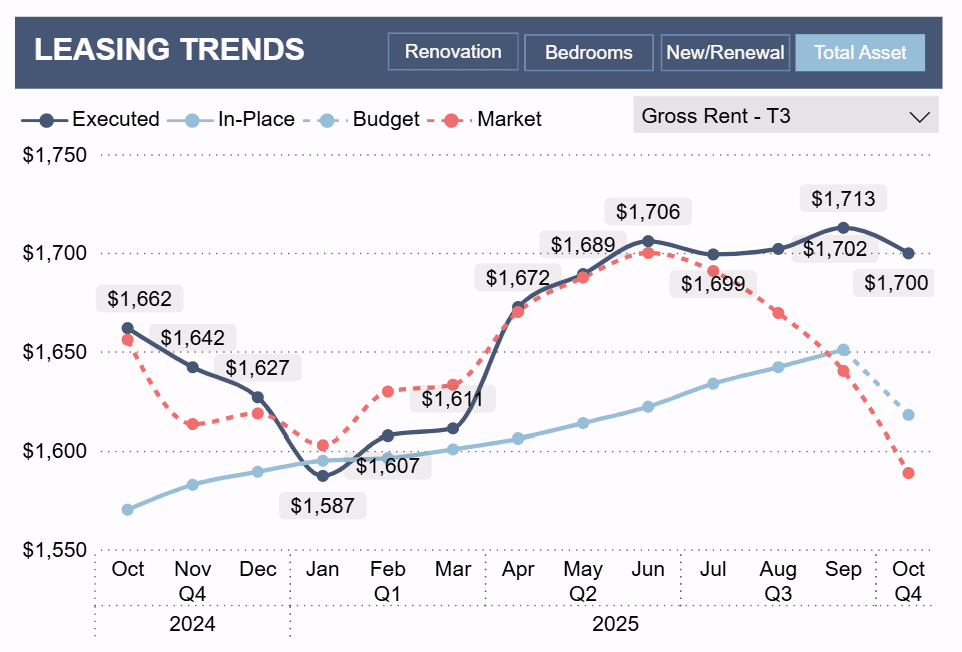
Know exactly where you stand. Compare your gross and net effective rents by bedroom type against what your competitors are actually achieving - not what they're asking for.

Concession and Pricing Context
Understand the full picture of market pricing. See average concession weeks, the percentage of leases with concessions, and how your pricing strategy compares to the competitive landscape.
Proven Results
+4.5%
Occupancy Improvement
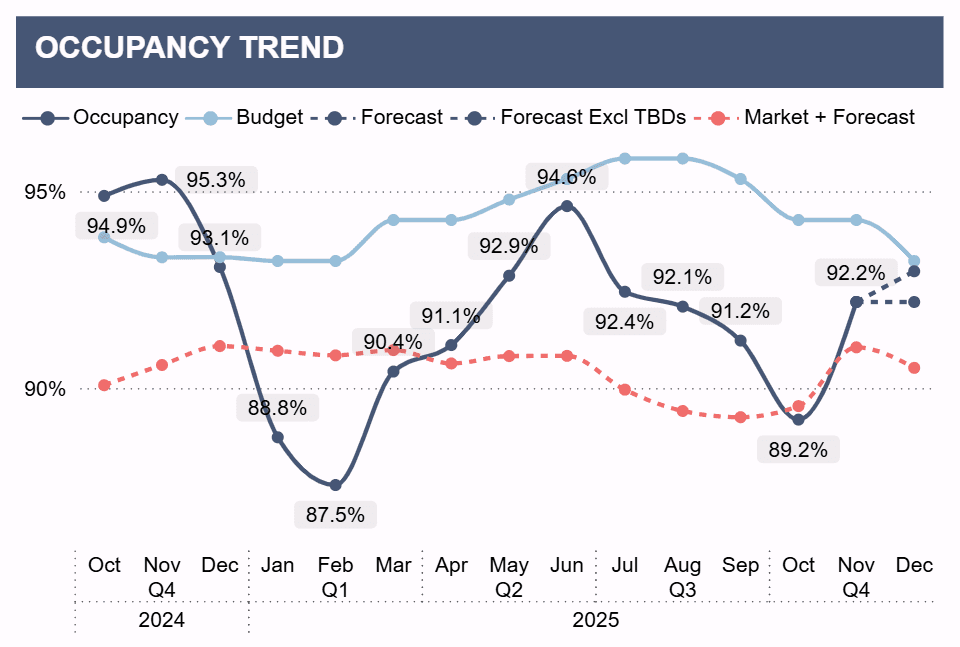
Market benchmarking helped identify pricing opportunities, improving occupancy from 90.5% to 95%.
Read Case Study+19%
Retention Boost
Competitive rent analysis informed renewal pricing strategy, boosting retention by 19%.
Read Case Study3.6 to 4.6
Google Rating Improvement
Reputation benchmarking against comps drove improvements from 3.6 to 4.6 stars.
Read Case StudySee BubbleGum BI on Your Own Assets
Book a walkthrough to see how multifamily asset managers use BubbleGum BI to understand occupancy, financials, and market position across their portfolio.
See Your Portfolio in Action